Source: Trustnet
The active versus passive debate is the wrong starting point for building portfolios, according to Jordan Sriharan, senior fund manager at Keyridge, who said multi-asset investors need to focus on how different tools are used rather than which camp they belong to.
“Some people sit firmly in passive or active camps, but that’s not how we think about multi-asset. You have to be pragmatic and consider portfolio construction across multiple layers,” he said.
“The universe has changed a lot over 10 years. If you don’t evolve, you risk being left behind.”
Sriharan runs a range of multi-asset funds of funds designed to sit within specific risk bands; each portfolio is built to stay within a target volatility range through a blend of active and passive strategies (both internal and third-party).
Within this structure, trackers are used “to implement tactical tilts and be more nimble”, while active managers are typically selected to deliver consistent returns relative to benchmarks with defined tracking error and return targets.
For example, Sriharan held a Nasdaq tracker over the past three years to increase exposure to US technology stocks, a position that has recently been sold; as well as a Euro Stoxx allocation to banks to express a view on European financials.
Sriharan does not to favour active or passive for the sake of it but looks at how the different style shapes asset allocation. Headline performance comparisons can hide more useful information, such as how much exposure a portfolio has had to the strongest-performing parts of the market (often represented by passives), particularly US equities over the past decade.
“Passive has driven an overweight to US equities through market-cap indices,” he said. “I think both passive and active advocates often underplay that in their return narratives.”
Choosing between an active or passive strategy carries different implications in fixed income too, where Sriharan said the limits of active management make the active-versus-passive distinction less useful.
“Up until five years ago, there weren’t many active managers in short-dated credit at a competitive price, so we used passives there. More managers have entered the space today, so we now only use passive exposure to add or remove beta,” he said.
An example is via the Vanguard Corporate Global Bond fund, which is a top 10 position in the fund at 4%.
To those who criticise the use of passives in fixed income because it amplifies exposure to the most indebted companies, the manager replied that it’s an easy criticism.
“These are large companies with strong cashflows and high interest coverage. They don’t become large borrowers without investor support,” he said.
Active managers also manage relative to benchmarks and are aware of index composition.
“In investment grade credit, alpha generation is typically 25 to 75 basis points net of fees. It’s difficult to outperform without taking meaningful off-benchmark risk, which doesn’t always improve risk-adjusted returns. Active managers often end up close to benchmark, so generating 50 to 75 basis points is a good outcome.”
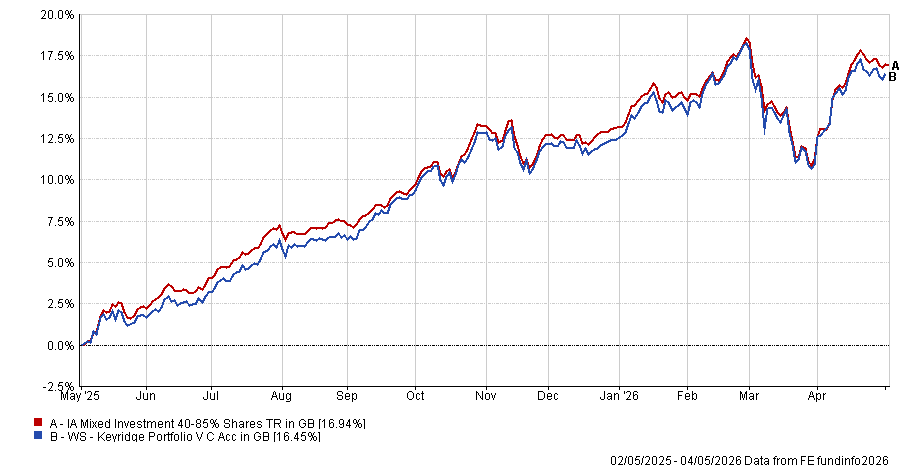
Performance of fund against index and sector over 1yr
Source: FE Analytics
Another point in the active versus passive debate is cost. The Keyridge portfolios operate under a total charge cap of 65 basis points, requiring careful trade-offs between internal and external and active and passive allocations. Internal strategies are used where possible to keep costs down, while external managers are brought in where specific expertise is needed.
In some cases, this involves working directly with managers to create tailored mandates, particularly in areas such as high yield or emerging market debt, where off-the-shelf funds may not meet cost requirements.
Sriharan said pricing must be assessed in the context of what a strategy is trying to deliver, rather than through a fixed threshold or a comparison with passives.
“If the price is right for the complexity of the asset class, we’re happy to pay it,” he said.
This is particularly true in areas such as alternatives, where higher fees may reflect more complex strategies and different return drivers.
The same principle applies at the total portfolio level where, instead of making large allocation shifts based on top-down views, Sriharan focuses on a small number of positions that can add value over time.
“We don’t take big swings like heavily overweight equities or underweight fixed income,” he said. “We focus on three or four alpha ideas.”
At the start of 2026, this meant a modest pro-risk stance, based on improving growth expectations over the medium term. Positioning was adjusted within asset classes rather than through large headline moves, including reducing exposure to the US and increasing allocations to emerging markets and Asia.
Following strong performance early in the year and a rise in volatility in March, equity exposure was trimmed slightly, with around 1 percentage point moved into fixed income and cash.
In a balanced portfolio, this results in an allocation of roughly 55% equities, 31% fixed income, around 9% alternatives and the remainder in cash.